
20. (a) Read the following paragraph and convert it into a diagram [1×4=4M]
[Pie Chart / Bar Graph / Tree Diagram / Flow Chart / Table]
OR
(b) Analyse the diagram and write it into a paragraph [1×4=4M]
[Pie Chart / Bar Graph / Tree Diagram / Flow Chart / Table]
1. Pie Chart
Example:
1. The following pie chart depicts the results of a survey regarding distribution of different Blood groups in a college. ( Page No 233 )
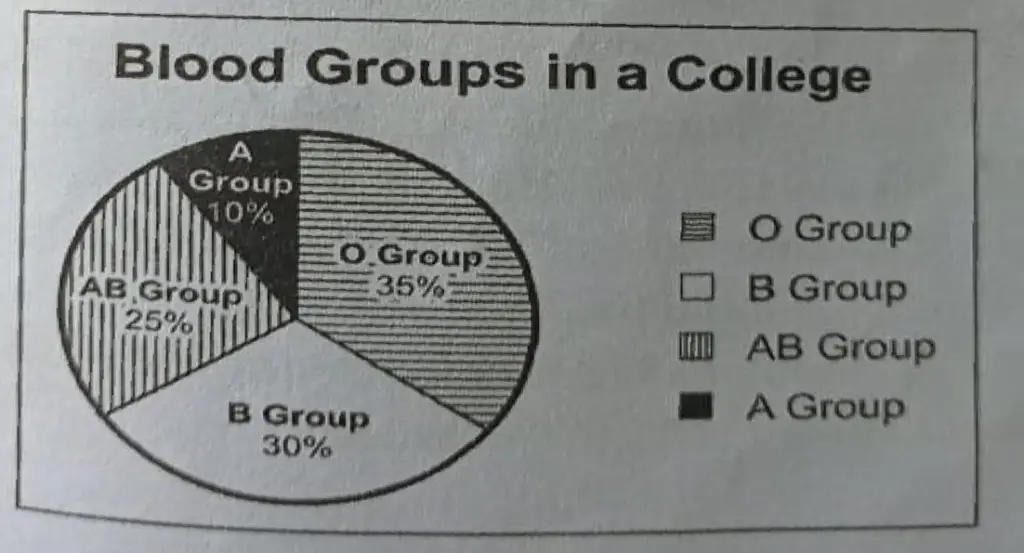
The Pie Chart Shows the results of a survey regarding the distribution of different Blood groups in a college, the four blood groups have been taken into consideration that is ‘O” group, “B” Group “AB” group “A” Group.
From the Pie Chart, we can say that 35% of the students of the college have O Group of Blood and these students form the largest group. The next largest group comprises students with B Group of Blood. 30% of students belong to this category. 25% of students have AB Group of Blood. Finally, we see that only 10% of students have A Group of Blood.
Thus, from the pie chart, we can conclude that many students have an O Group of Blood, and very few have an A Group.
2. The following pie chart depicts the favourite subject of students in a class. (Page No 234)
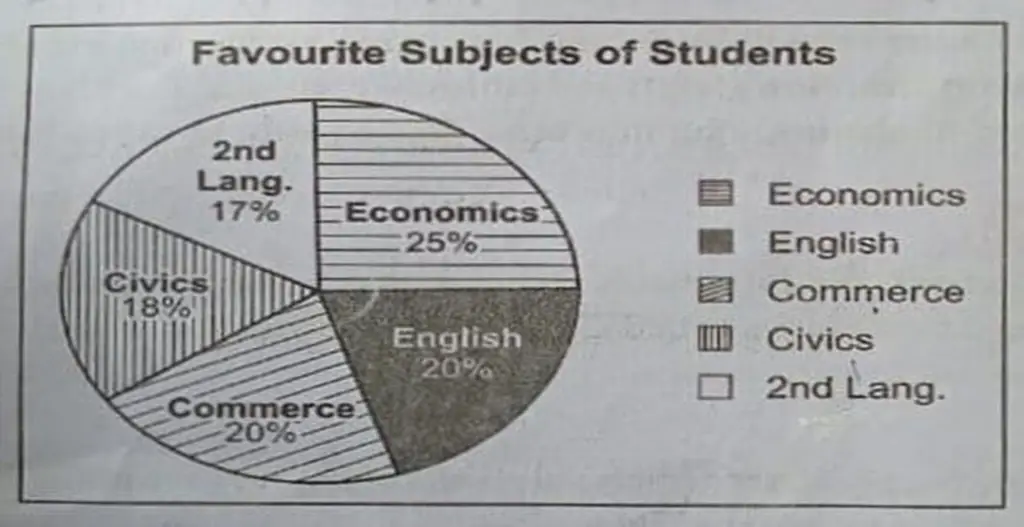
The Pie Chart shows the favourite subject of students in a class, the five subjects are taken into consideration, i.e Economics, English, Commerce, Civics, 2nd Language.
From the Pie Chart, we can say that five subjects have been taken into consideration-Economics, Civics, Commerce, English and 2 Language. Students 25 who like Economics form the largest group. A quarter of the students of the class Student i.e., 25% expressed a preference for this subject. English and Commerce are liked by an equal number of students. 20% of the students like English and the same percentage i.e., 20% of the students like Commerce. Next in popularity is Civics, liked by 18% of the class. Finally 17% of the students like 2nd Language.
Thus from the Pie Chart, we can conclude that majority of the student like economics whereas 2nd Language is liked by fewer.
Exercises
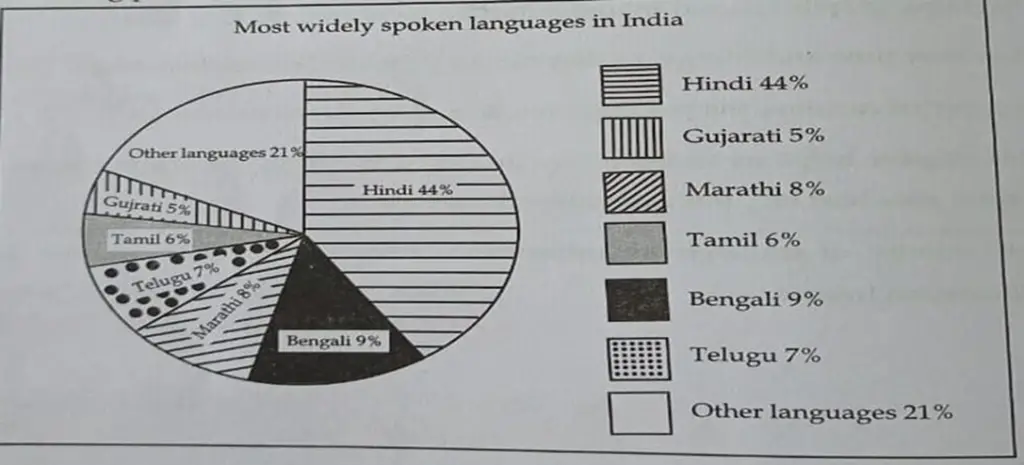
1. The following paragraph gives the information about the most widely spoken languages in India. Convert the passage into a pie chart. (Page 235)
Hindi is the most widely spoken language in India. The fact that 44% of Indians speak Hindi across India justifies its title as our National Language. 9% of Indians speak Bengali followed by Marathi which is spoken by 8%. Telugu comes next in the list with 7%. Tamil and Gujarati account for 6% and 5% respectively. All other languages together share the remaining percentage.
Answer: The following pie chart shows the most widely spoken languages in India.
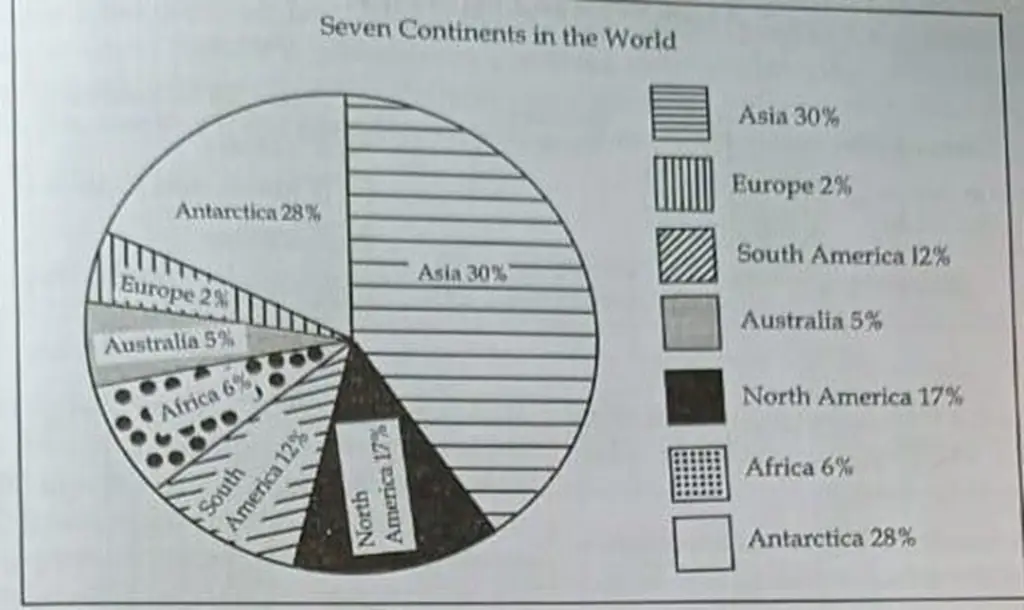
2. Read the following paragraph and convert the information into a pie chart.
There are seven continents in the world. Asia is the largest continent with an area of 30% followed by Antarctica with 28%. North America occupies 17% of the land on the earth. South America stands fourth in the list with 12% of land. Africa and Australia are the fifth and sixth largest ones with their respective shares of 6% and 5%. Europe is the last in the list which occupies 2% of the land only. [ Page No 235 ]
Answer: The following pie chart represents information about the seven continents in the world.
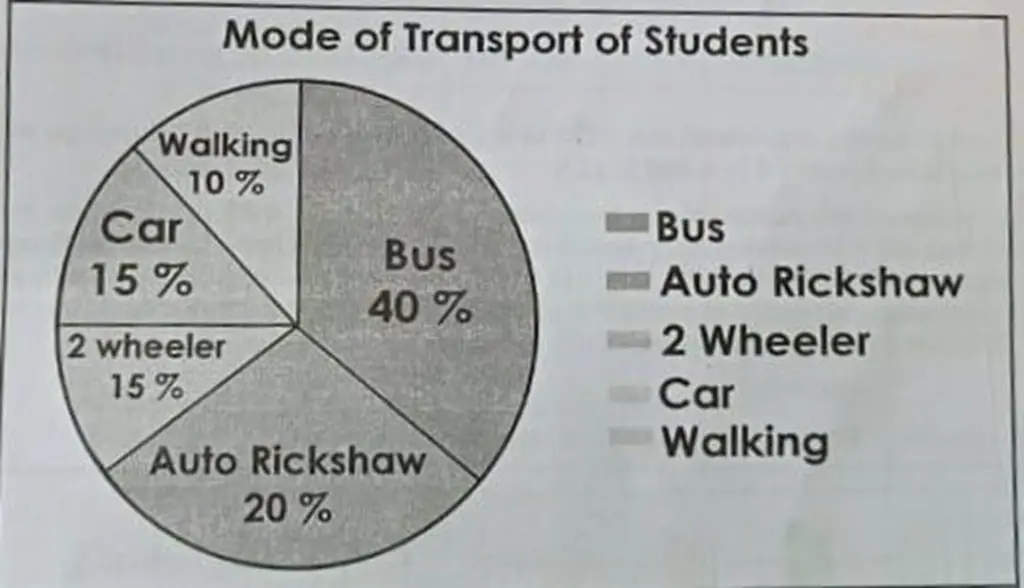
3. Observe the pie chart given below. It contains information about the mode of transport used by the students of a certain Junior College. Write a small paragraph. [ Page No 235 ]
Answer:
The Pie chart contains information about the mode of transport used by the students of a certain Junior College, the five modes of transport are taken into consideration, i.e Bus, Auto Rickshaw, Two Wheeler, Car and Walking.
The students of a particular Junior College use different modes of transport to reach the college. Most of them use buses as their mode of transport. 40% of them use buses. 20% of the students come to college in auto rickshaws. 15 % of the students come by two-wheelers. Another 15% come to the college by car. Only 10% of the students come on foot.
Thus from the Pie Chart we can conclude that majority of the student come to college by bus, whereas few come to college by walk.
4. The pie chart given below shows how people spend their time on smart phones. Convert the information into a paragraph. [ Page No 236 ]
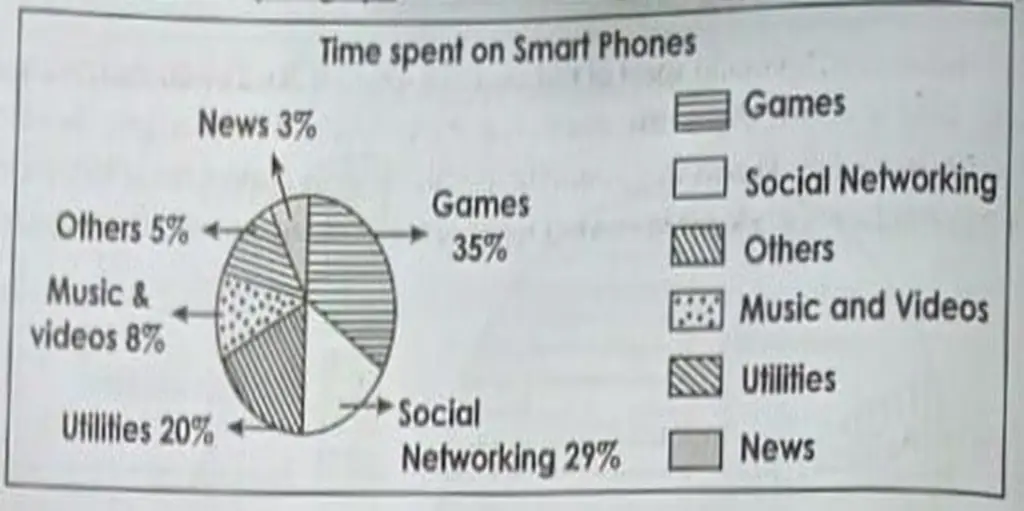
The Pie Chart shows how people spend their time on smartphones. The six activities are taken into consideration that is Games, Social Networking, Music & Video, Utilities, and others.
From the Pie chart, the major share of time is attributed to both games and social networking, which is 35% and 29% respectively. However, the time spent on utilities is 20% which is next to social networking. People spend 8% of the time enjoying music and videos and 5% time on others. News is recorded as comparatively the least popular activity with merely 3%.
Overall, it is clear that games and social networking are popular activities when compared to other uses.
2. Bar Graph
Example
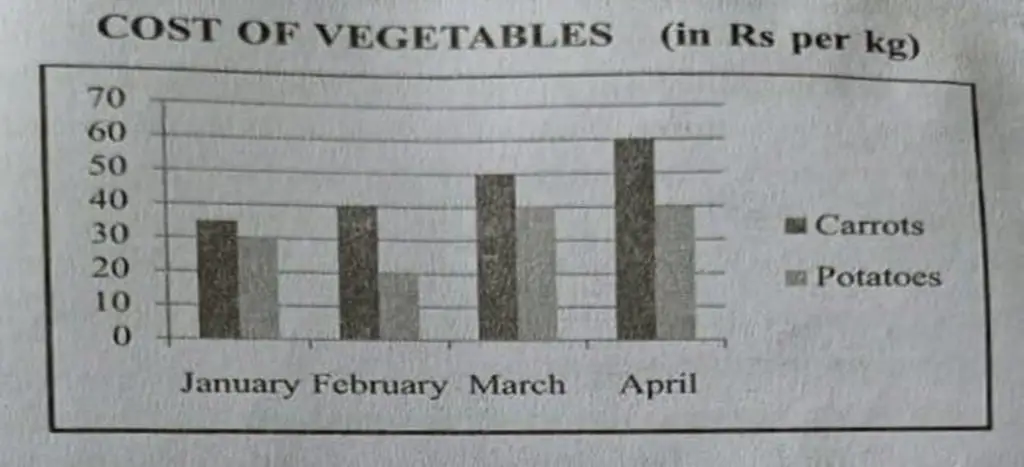
1. The bar graph given below shows the cost of carrots and potatoes over a period of four months-January, February, March and April. Carrots were costlier than potatoes during all the months. In January carrots cost Rs 35 a kilo, while potatoes cost a little less, at Rs 30 a kilo. The cost of carrots increased to Rs 40 in February, while there was a sharp fall in the cost of potatoes. There was a sharp rise in the cost of both the vegetables after that and in March the cost of carrots was Rs 50 per kilo while that of potatoes was Rs 40. In April once again there was a steep increase in the cost of carrots but the cost of potatoes remained the same.
Thus we observe that the cost of carrots kept increasing over the months but that of potatoes fluctuating. [ Page No 236 ]
Answer:
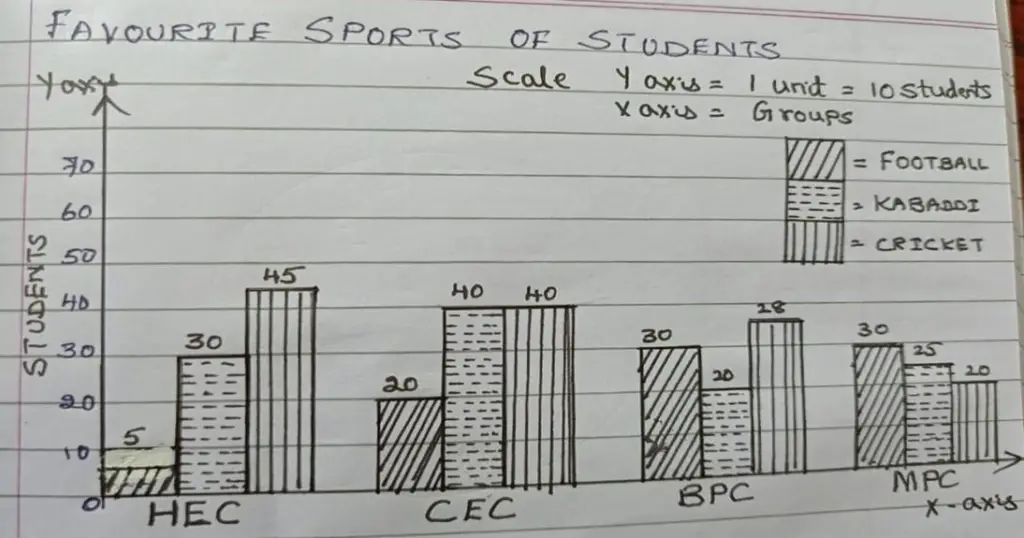
2. The following bar graph represents the favourite sports of various group of students studying in a college.
Students of four sections HEC, CEC, BPC and MPC were asked about their preferences in sports. The number of students in each section varied. Three sports were considered-football, cricket and kabaddi. HEC students expressed great interest in cricket. 50 out of 85 students i.e., more than half liked cricket. Very few in that section, just 5,were fond of football. 30 liked kabaddi. In the CEC section, consisting of 100 students, an equal number of students i.e., 40 liked kabaddi and cricket. 20 liked football. With regard to the science sections, cricket was more popular among BPC students. 38 students of BPC liked cricket whereas 20 students of MPC favoured it. An equal number in both the sections, 30, were fond of football. The figures for kabaddi too were more or less the same i.e. 20 in BPC and 25 in MPC. The BPC section consisted of 88 students while MPC students were 75 in number. On the whole, one can conclude that cricket is the most popular sport in the college, followed by kabaddi. [ Page No 237 ]
Answer:
Exercises
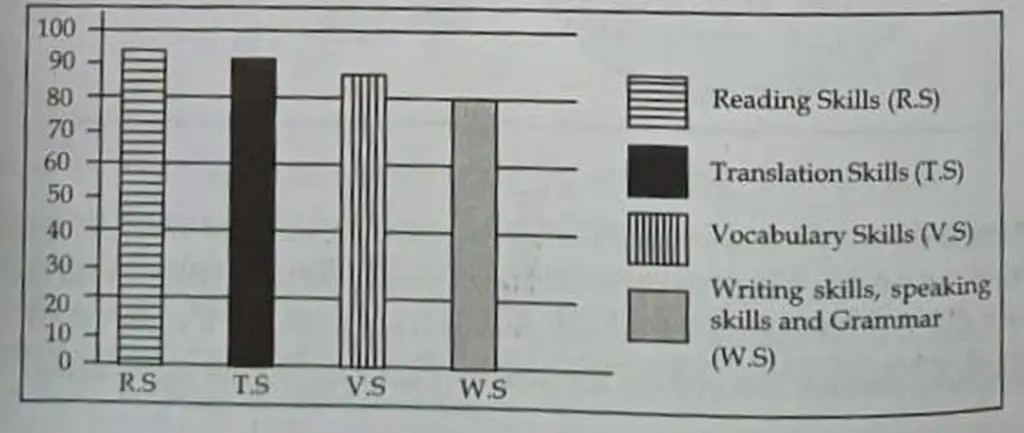
1. The passage below represents the data of improvement of English language skills due to Internet usage. Present it in a bar graph. (Page No 238)
Internet plays an important role in improving Reading skills. 94% participants in this study agreed that they improved their Reading skills by using Internet while 91% opined that they improved Translation skills. Internet usage helped 87% of participants in enhancing their Vocabulary skills. 80% of participants unanimously agreed that they improved Writing skills, Speaking skills and Grammar.
Answer: Improvement of English language skills through internet
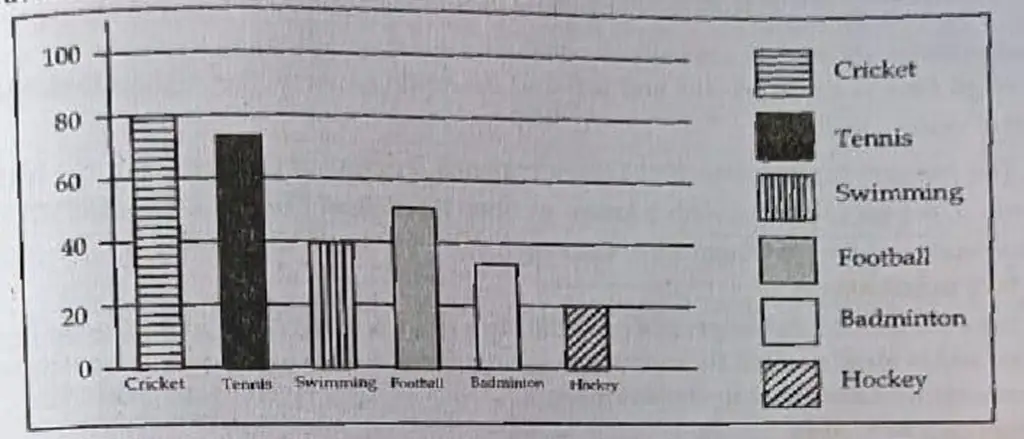
2. The following passage shows the favourite sports of the students of a school. (Page No 238)
Cricket is the most favourite sport of the students which is liked by 80 students. Tennis falls behind Cricket with a slight difference. It is the favourite of 75 students. Swimming and Football are liked by 40 and 45 students respectively while Badminton is the favourite of 30 students. Hockey is the least favouring sport of the students which is liked by 20 students only.
Answer: Favourite sports of the students of a school
3. Analyse the bar graph given below and write about it in a paragraph. [Page No 238]
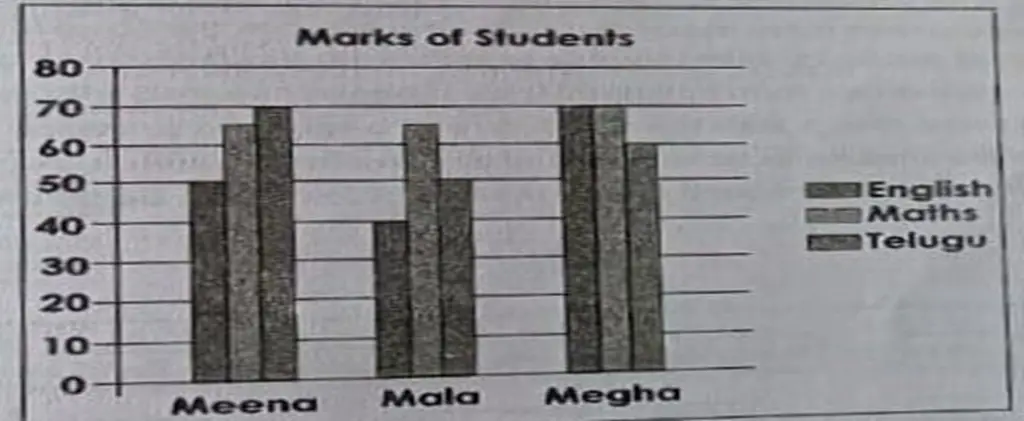
The above bar graph represents the marks obtained by three girls namely, Meena, Mala, and Megha in English, Maths and Telugu subjects.
Meena got seventy (70) marks in Telugu and sixty-five marks in Maths. She got only 50 marks in English. Mala got sixty-five marks in Maths, fifty in Telugu and forty in English. Megha obtained 70 marks each in English and Maths and in Telugu she got only 60 marks.
Thus from the Bar Graph, we can conclude that Megha got the highest mark in English & Music, whereas Meena got the highest marks in Telugu.
4. The given below bar graph shows how much dietary fibre is found in certain fruits. Convert it into a paragraph. [Page No 238]
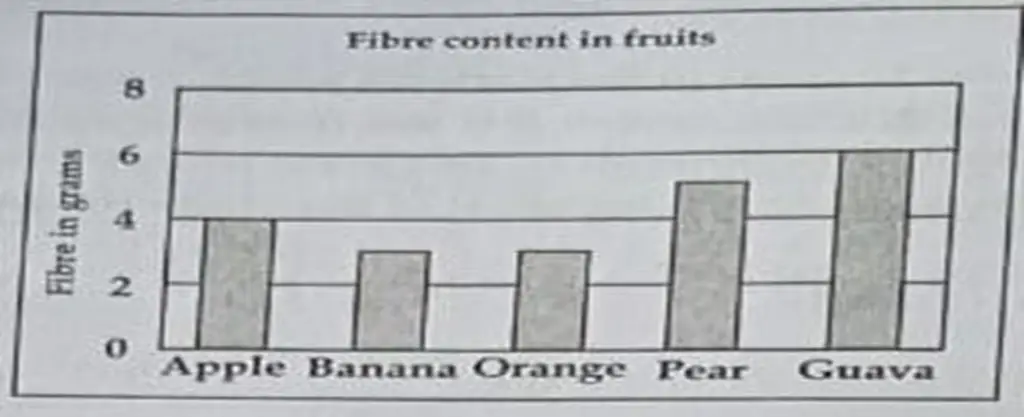
The bar graph shows how much dietary fibre is found in certain fruits, the five fruits are taken into consideration that is apple, banana, orange, pear, and guava.
High fibre is a healthy diet and is found in certain fruits. A diet high in fibre keeps the digestive system healthy. The bar graph represents that Guava contains 6 grams of fibre which is the highest of all fruits. The pear falls next with 5 grams of fibre. Apple can provide 4 grams of fibre while bananas and oranges have 3 grams of fibre each.
Thus from the bar graph, we can conclude that Guava has got much dietary fibre whereas orange has less.
TREE DIAGRAMS
Example
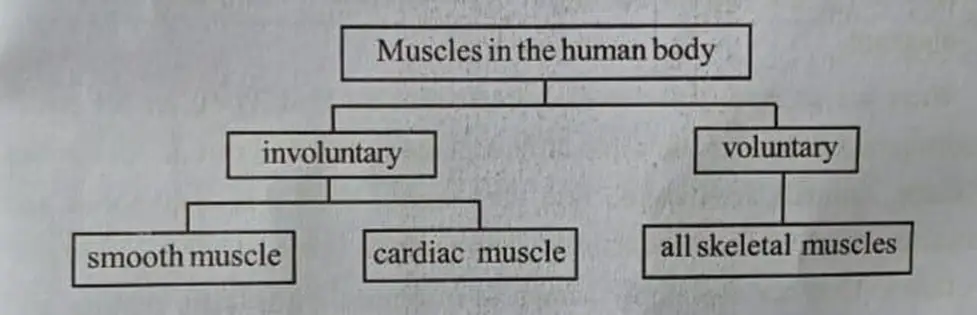
1. There are three types of muscles in the human body. They are smooth, cardiac and skeletal muscles. Smooth muscles are controlled by involuntary responses. Examples of smooth muscles are muscles in the digestive tract and blood vessels. The second type of muscle is cardiac muscle. It is also an involuntary muscle. Muscles that cover the heart are examples of cardiac muscles. The third type of muscle is the skeletal muscle. It is controlled by voluntary response. All the muscles attached to the bones such as biceps, deltoid are examples of skeletal muscles. This paragraph can be depicted in the form of a tree diagram as follows. [Page No 239]
Answer:
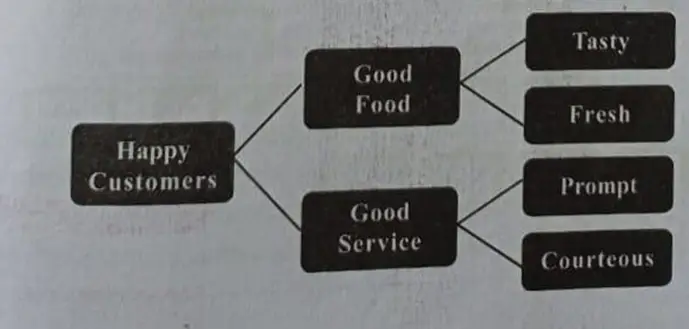
2. A man who managed a popular hotel was asked the secret of his success. He said that only when customers were happy with the dining experience would they keep returning to the hotel. Dining would be a pleasant experience only if the food served was of a high standard. Good service too was equally important. He elaborated that food should be tasty and fresh. Service should be prompt and courteous. Given below is a tree diagram representing the man’s views. [Page no 239]
Answer:
Exercises
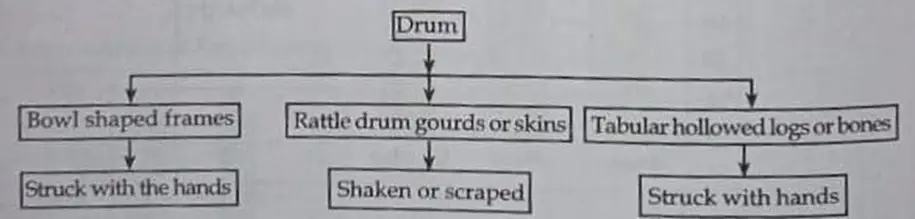
1. Read the following paragraph and transfer the information into a tree diagram. The oldest musical instrument in the world is the drum, made initially in one of the three ways. First, frame drums were made by stretching the skin over bowl shaped frames. Next, rattle drums were made by filling gourds or skins with dried grains, shells, or rocks. Finally. Tubular drums were made form hollowed logs or bones covered with skins. Both frames and tubular drums were struck with the hand or with beaters to produce sounds. In contrast, rattle drums were shaken or scraped to make rhythmic sounds. For thousands of years, drums have been used to transmit messages to call soldiers to battle and make music. [Page no 240]
Answer:
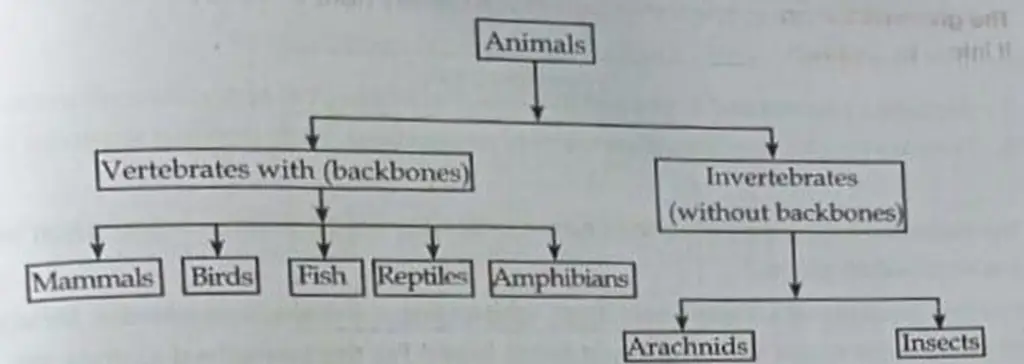
2. Read the following paragraph and transfer the information into a tree diagram. There are so many species of animals that we find living on the earth. Scientists grouped these animals into different classes based on certain similarities they share. Animals are divided into vertebrates, ones with backbones and invertebrates, those without backbones. The vertebrates are basically divided into five classes. They are commonly known as mammals, birds, fish, reptiles and amphibians. Arachnids and insects are the two commonly known classes in the invertebrates group. [Page no 240]
Answer:
3. The following free chart depicts the classification of Vitamins. Present the information in a paragraph. [Page no 240]
Answer:
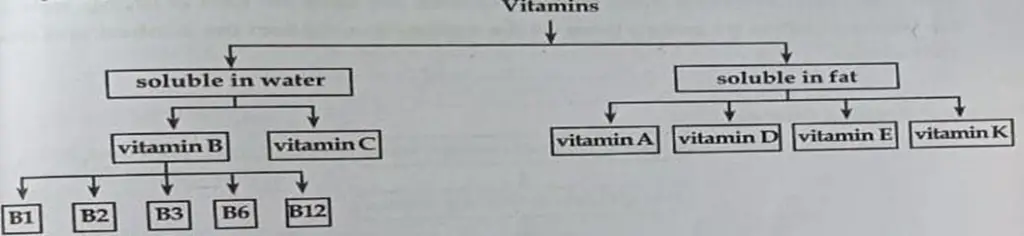
The Following Tree Diagram classification of Vitamins.
Vitamins are vital for good health. They are most important for the processing of energy in cells. Vitamins are classified based on their solubility. The fat-soluble vitamins are A, D, E and K. The water-soluble vitamins are the B-complex vitamins and vitamin C.
A group of vitamins with different characteristics are grouped under vitamin B. They include vitamin B1,B2,B3,B6 and B12.
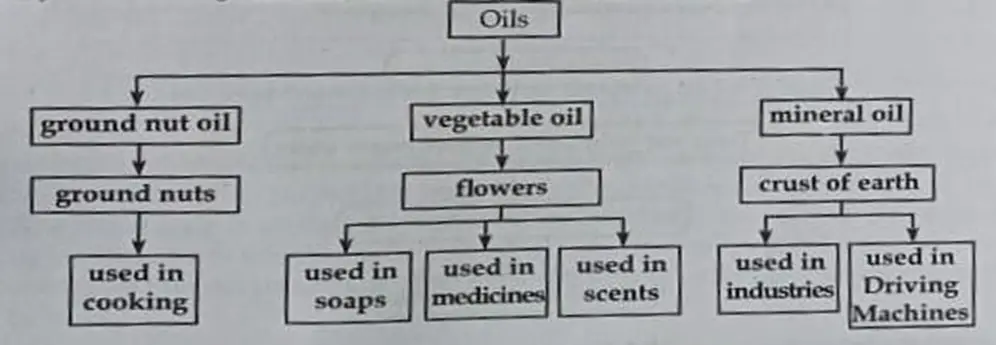
4. Study the following tree diagram and write it in a paragraph. [Page no 241]
Answer:
Oils are used for so many and varied purposes. There are three types of oils: groundnut oil, vegetable oil and mineral oil.
Groundnut oil is extracted from groundnuts and is used for cooking purposes.Vegetable oil is extracted from flowers and is used in soaps, medicines and scents. Mineral oil is taken out of the earth’s crust in the form of crude oil. It is mostly used in industries and for driving machines.
FLOW CHARTS
Example:
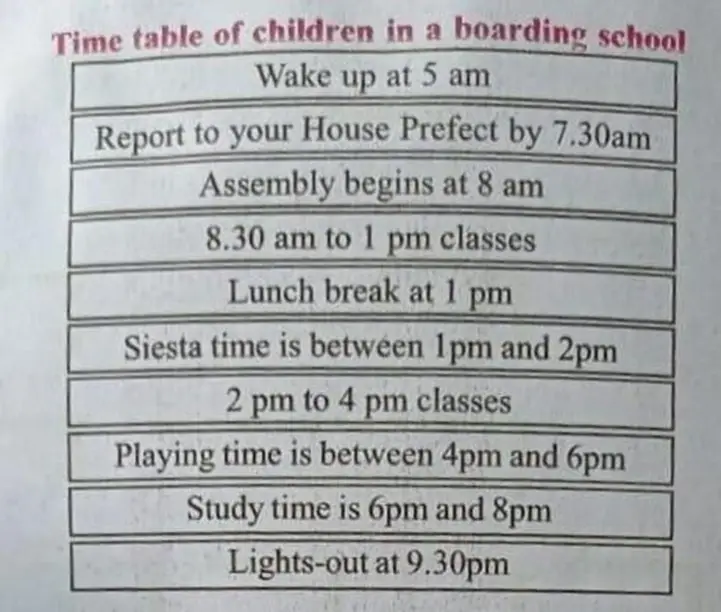
1. Now, observe how the following passage is presented in a flow chart. The passage shows the time table for children in a boarding school.
You are supposed to wake up at 5 am every day and lights-out time is 9.30 pm. Siesta time is between 1 and 2 in the afternoon. Assembly begins at 8 am sharp in the school hall. You have to report to your House Prefect by 7.30 am on all school days. You may play any game between 4 and 6 pm. You must not be late for study time which is between 6 and 8 in the evening. School timings are from 8.30 am to 3.30 pm with an hour-long lunch break at 1 pm. These details are shown in a flow chart. [Page no 241]
Answer:
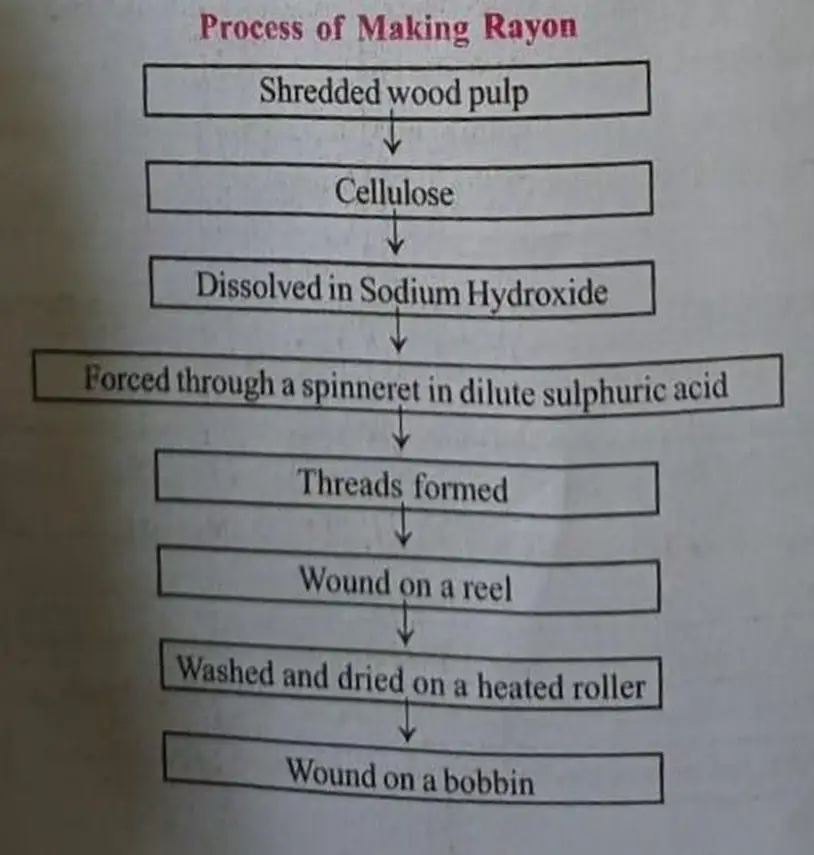
2. Read the following paragraph and transfer the information into a flow chart.
Rayon is a man-made fiber. It is a reconstituted natural fiber-cellulose. Rayon is made by dissolving cellulose in a solution of sodium hydroxide or caustic soda. The cellulose is obtained from shredded wood pulp. The dissolved cellulose is formed into threads by forcing it through a spinneret in a dilute sulphuric acid setting bath. The threads are drawn from the setting bath, wound on a reel, washed, dried on a heated roller, and finally wound onto a bobbin. [Page no 242]
Answer:
Exercises
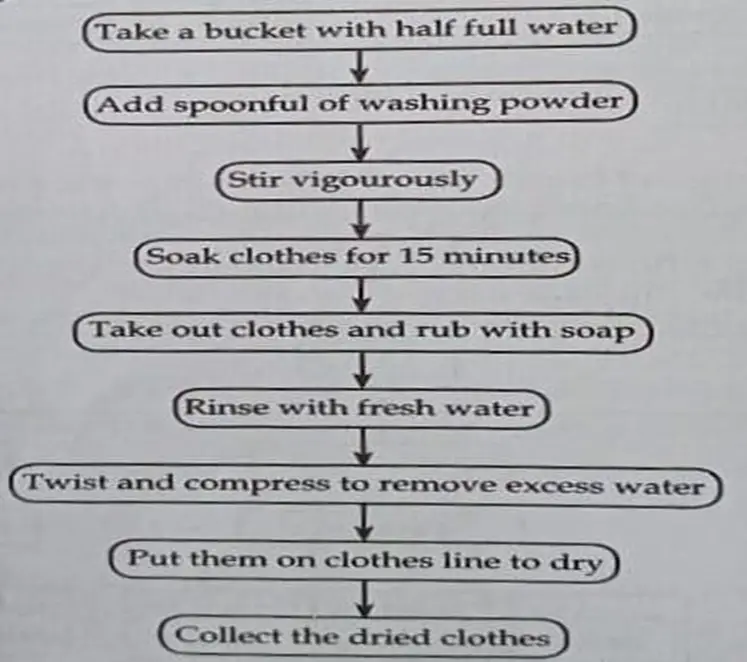
1. The following paragraph describes how clothes are washed. Draw a flow chart based on the information given.
First, fill a bucket half full with water. Then, add a spoonful of washing powder. Stir vigorously till the powder mixes with water and forms foam. Put the unwashed clothes into it. Walt for fifteen minutes. Take out clothes and scrub with a brush to remove stains. Now, rinse the clothes with clean water. Wring out the clothes gently by twisting and compressing them. This removes excess water from the clothes. This save the time of drying. Now dry the washed clothes by putting them on the clothes line. Collect the washed and dried clothes later. [ Page No 243 ]
Answer: Process of Washing Clothes
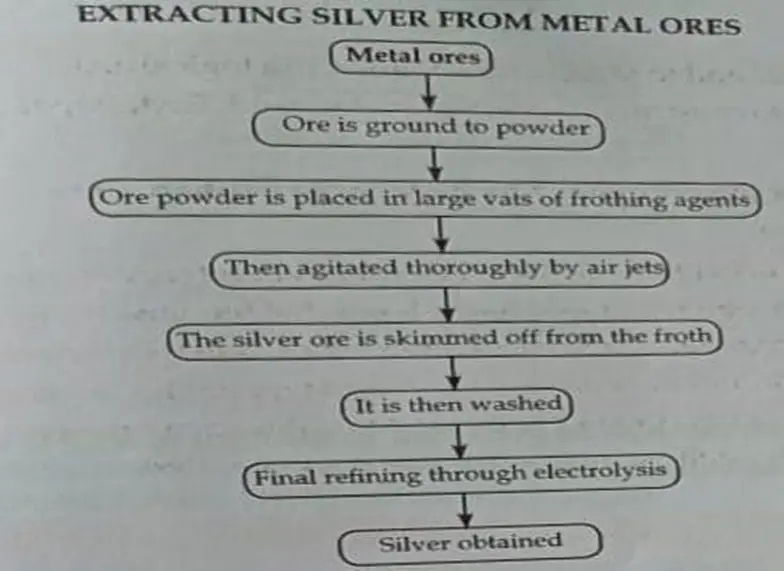
2. Convert the following paragraph into a flow chart.
Silver occurs in the ores of several metals. The frothing process of extracting silver accounts for about 75% of all silver recovered. Here the ore is ground to a powder, placed in large vats containing a water suspension of frothing agents, and thoroughly agaitated by air jets. Depending on the agents used, either the silver-bearing ore or the gangue adhering to the bubbles of the foam is skimmed off and washed. The final refining is done using electrolysis. [ Page No 243 ]
3. The following flow chart describes how paper is manufactured in a paper mill. Write the details in a paragraph. [Page 243]
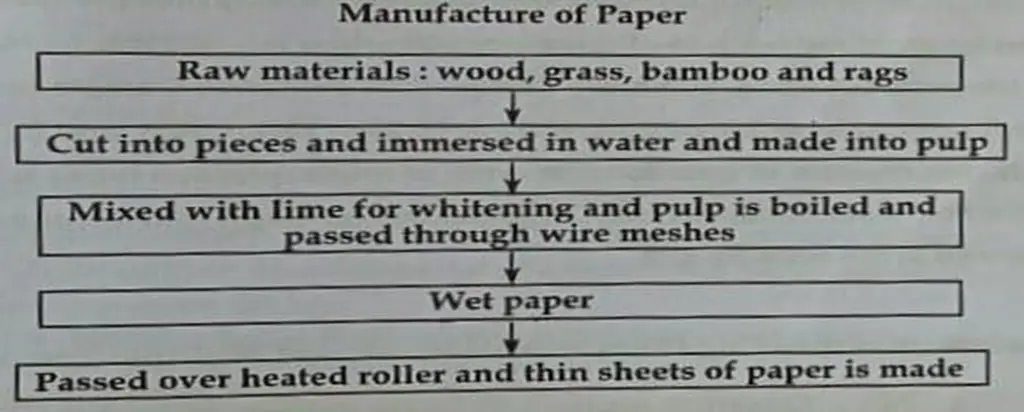
The flow chart shows paper is manufactured in a paper mill
Paper can be manufactured from wood, grass, bamboo and rags. To make paper from trees, the raw wood has to be turned into pulp. To do this, wood is cut into pieces and
immersed in water. The wood pulp is mixed with lime for whitening and then boiled. It is then made to pass through wire meshes which results in the production of wet paper. To dry this wet paper and to make it into thin sheets of paper, it is passed over a heated roller. Paper sheets are now ready to be used.
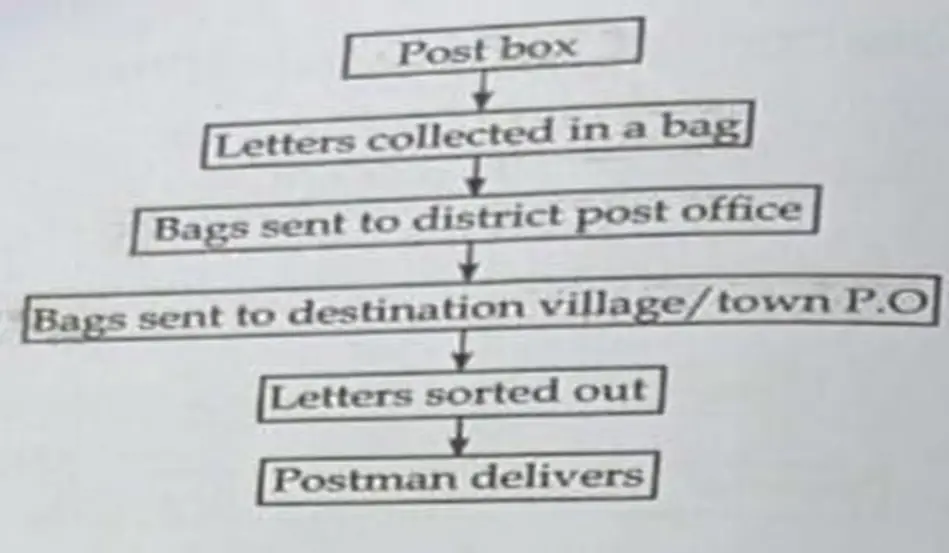
4. Draw a flow chart based on the information given below.
The following process is the description of how a post office transfers a letter from a sender to the receiver. First, the sender posts the letter in a post box. Next, the box is opened. Then the contents in it are sorted out. Then they are kept in a bag and the bag is tied. The destination is written on the bag. The bags are sent to the district post office. The district post office sends the bags to the destination village/town post offices. The destination post office receives the letters. The received letters are arranged and sorted out. The postman delivers the letters to the addresses. [Page 244]
Answer: Process of Letter Transferred to Post Office
5. Tables
Example
1. Given below are the marks secured by Aravind, Akash and Ramesh in their half-yearly examinations of class X. [Page no 244]
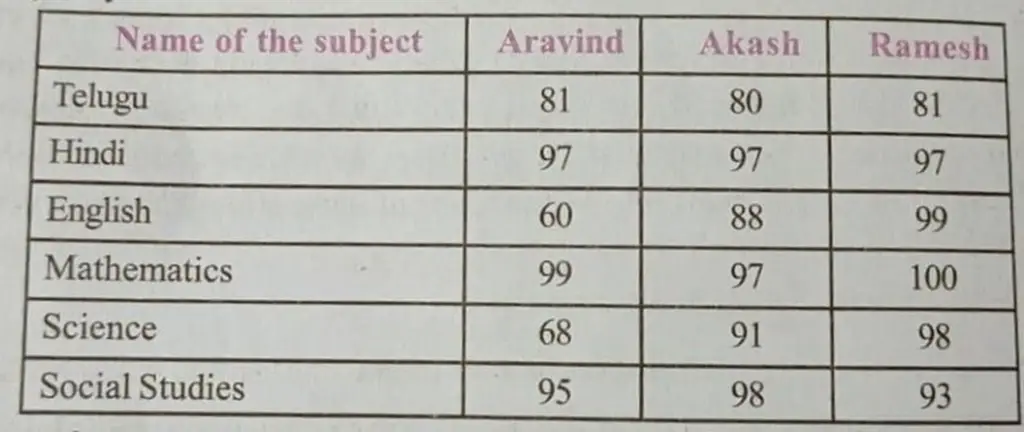
The table shows the marks secured by Aravind, Akash and Ramesh in their half- yearly examinations of class X. Aravind scored 81 in Telugu, 97 in Hindi, 60 in English, 99 in Mathematics, 68 in Science and 95 in Social Studies. The marks of Akash and Ramesh are: Telugu-80, 81; Hindi – 97, 97; English-88, 99;
Mathematics -97, 100; Science – 91, 98 and Social Studies – 98, 93 respectively.
2. The following table shows the number of gold medals won by 8 participating countries in the XII South Asian Games 2016. First read the data given in the table. (Page No 245)
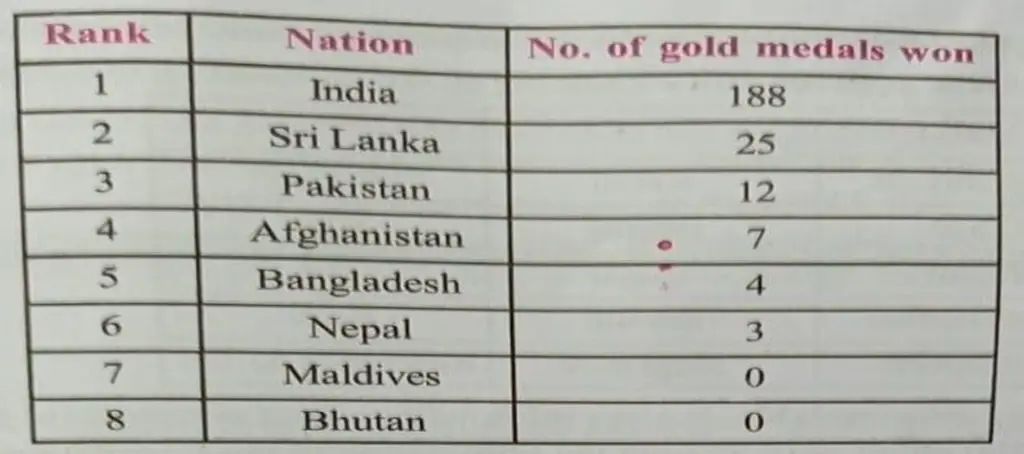
The above table gives information about the number of gold medals won by 8 participating countries in the XII South Asian Games 2016. India secured the first rank with 188 gold medals. It was far ahead of the other countries. Sri Lanka was ranked 2, securing only 25 gold medals. Pakistan got only 12 gold medals and was ranked 3. The next country in the list is Afghanistan with 7 gold medals followed by Bangladesh and Nepal with 4 and 3 gold medals respectively. Maldives and Bhutan which stood at the bottom of the table got no gold medals. This table shows the commendable performance of India in the XII South Asian Games.
Exercises
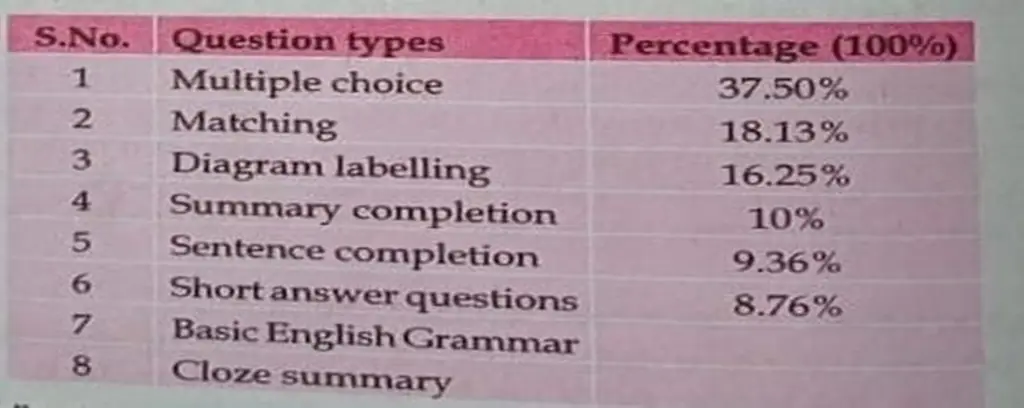
1. Read the following paragraph and transfer the information into a table. A reading test assesses reading comprehension by employing multiple testing technique represented by eight main types of questions.
Question types, such as Multiple-Choice Matching, Diagram Labelling, Summary Completion, Sentence Completion, Short Answer Questions with percentage, i.e. 37.50%, 18.13%, 16.25%, 10%, 9.36%, and 8.76%, take place respectively. The number of questions for each of these question types is variable. Basic English grammar, cloze summary, percentages are although with lower portions and are also considered in the reading test. [Page No 245]
Answer: Assessment of Reading Comprehension through Multiple Testing
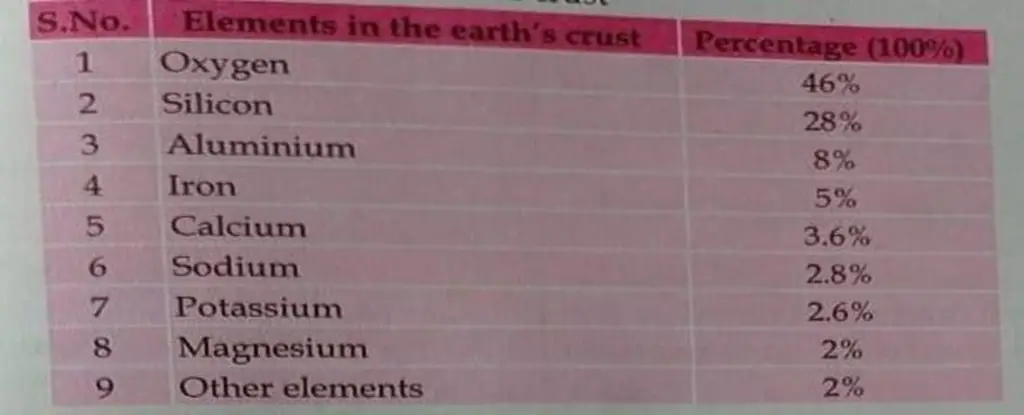
2. Convert the following paragraph into a table. There are many elements in the earth’s crust. Oxygen occupies 46%, silicon 28%; aluminum 8%; Iron 5%, Calcium 3.6%; sodium 2.8%; potassium 2.6%; magnesium 2%; certain other elements occupy 2% of the earth’s crust. This is what we mean by the abundance d elements in the earth’s crust. [Page No 246]
Answer: The Table shows the Elements in Earths Crust
3. Study the table below showing a few Asian countries with their capitals and currencies. Write a paragraph using the information in the table. [Page No 246]
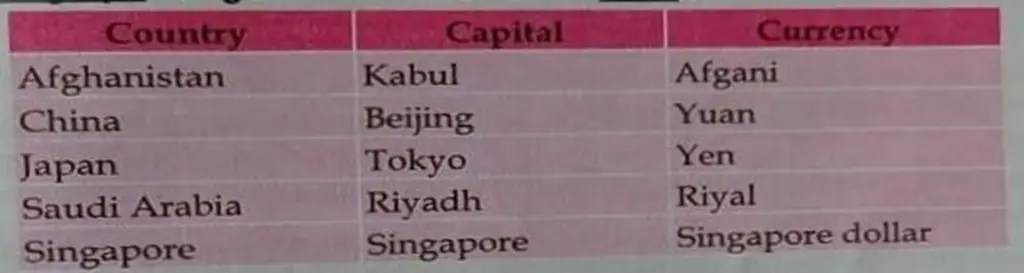
The table above shows a few Asian countries with their capitals and currencies. Kabul is the capital of Afghanistan and the currency used in Afghanistan is Afghani. China’s capital is Beijing and its currency is Yuan. Tokyo is the capital of Japan which uses Yen as its currency. Saudi Arabia is a gulf country. Its capital is Riyadh and its currency is known as Riyal. Another Asian country is Singapore and its capital also bears the same name. The currency used in Singapore is the Singapore dollar.
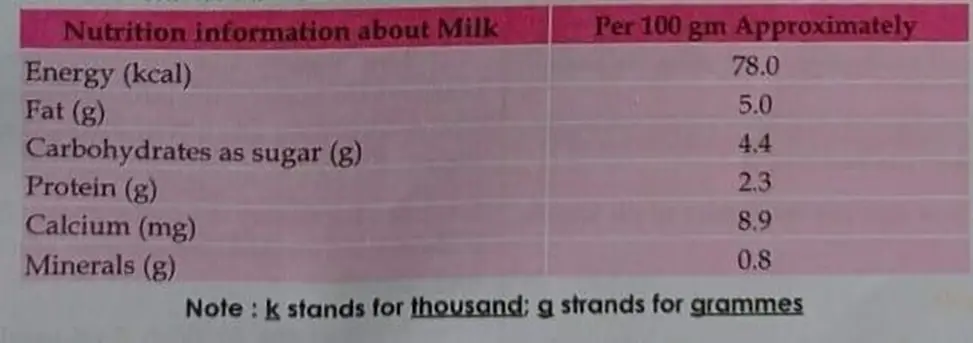
4. Look at the following table. It gives information about nutrients (in gms) present 100ml. of in milk. Present the information in the form of a paragraph. [Page No 246]
Answer:
The table above lists the nutrients (in gms) that can be found in milk.
In 100 gm milk, energy (kcal) is around 78.0, while fat is roughly 5.0g. In the same 100 gm of milk 4.4g of carbohydrates are found in the form of sugar. The protein content is 2.3 gms whereas minerals content is only 0.8 grams in 100 grams of milk. However, 100 gm milk contains 8.9 milligrams of calcium.
