
9. Read the Pie Chart/Bar Graph/Tree Diagram/Table/ Flow Chat and answer ANY FOUR questions given after it. [ 4×1 = 4 Marks ]
[ Pie Charts ]
1] The performance of the undergraduate students in the final year examination is presented in the form of a Pie Chart. Study it and answer the questions that follow. [ Pg:147]
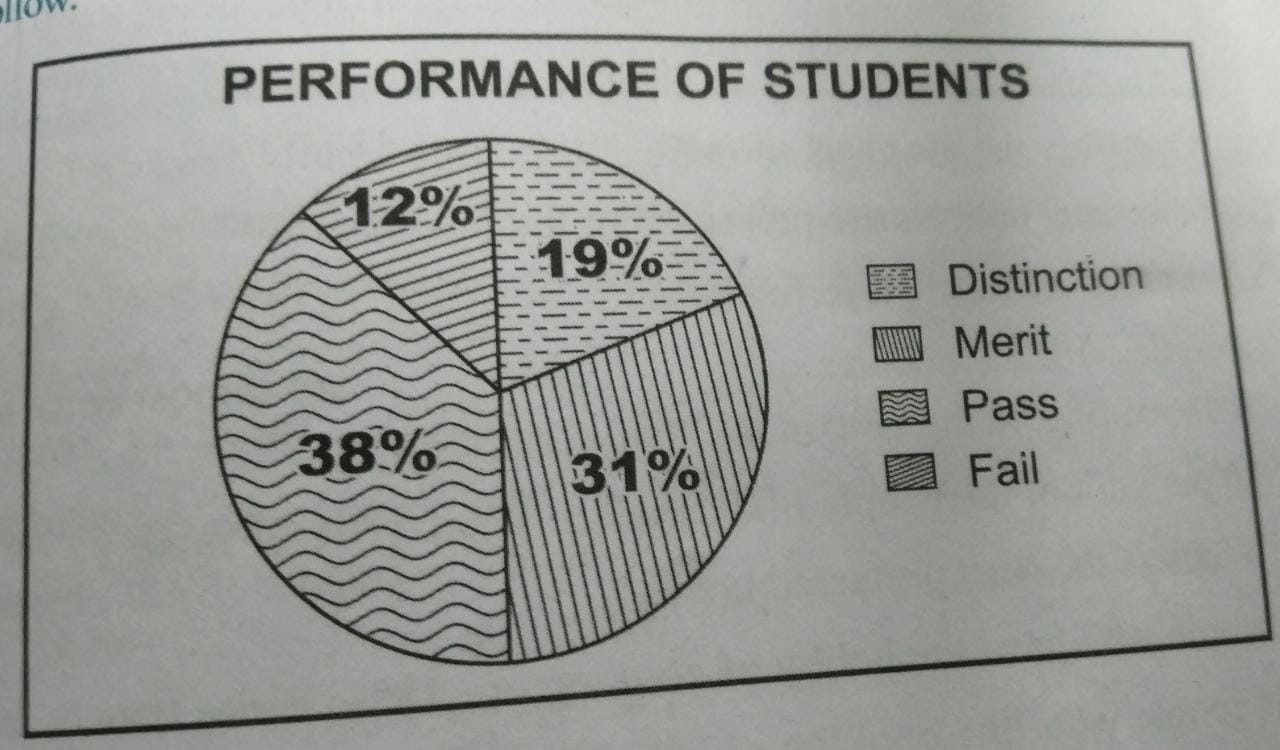
i] How many segments are given in a pie chart?
A] Four
ii]What percentage of students just passed as shown in the chart?
A] 38
iii]What percentage of students got merit?
A] 31
iv]What is the total pass percentage of students?
A] 88
v]What percentage of students got distinction?
A] 19
vi]What is the combined percentage of students who just passed and who get merit?
A] 69
vii] When compared, the number of students who passed with distinction is more than those who passed with a merit. [ true or false]
A] false
viii] If the total number of undergraduates who appeared for the final year examination is 100, then how many students failed as per the chart?
A] 12
2] The Pie Chart given below provides information about some of the hobby people have. Study the chart carefully and answer the questions that follow.[ Pg:148]

i]What does the pie chart show?
A] Hobbies of people
ii]How many hobbies are present dead in the pie chart?
A] Four
iii] Which is the most preferred hobby?
A] Reading
iv]People with the hobbies of ____ and _____ are almost equal to those with reading hobby (fill in the blanks)
A] Cooking-dancing
v]30 per the people who like dancing. Write true or false.
A] False
vi]Which is the least preferred hobby?
A) cooking
vii]People who have the hobby of cooking are 18% write true or false.
A] true
viii] If people who like cooking also liked dancing, then what would be the percentage of people who like dancing?
A] 41
3] Study the following pie chart and answer the question that follows.[Pg:149]

i] What does the pie chart show?
A] Cost of construction of a house
ii]How many categories are presented in the pie chart?
A] 6
iii] What portion of the total cost is spent on cement?
A] 20%
iv] What portion of the total cost is spent on bricks?
A] 15%
v] If the owner himself had supervised the construction of the house, what percentage of the amount would he have saved?
A] 15%
vi] The cost spent on timber is 10%. write true or false.
A] True
vii] If the cost of Steel were lower than Timber and the engineer had decided to use Steel instead of timber, would the cost of the entire house go down or go up?
A) go down
viii]What percentage of the cost is spent on supervision?
A) 15
Extra ] Study the pie chart below and answer any six questions given after it.

I] What does the pie-chart show?
A] Favorite beverages of people.
2] How many beverages are taken into account.
A] five [5]
3] What is the most preferred beverage?
A] Coconut water.
4] How many people preferred coffee?
A] 15%
5]What is the least preferred beverage?
A] Sugarcane Juice
6] People who preferred tea are_________.
A] 25%
7] People who preferred cola are_________.
A] 12%
8] People who preferred coconut water are 27%. Write true or false.
A] False.
[ Bar Graph ]
4] Here is a comparative study of population in five major cities in India. These figures are represented in a form of bar graph. Look at the graph and answer the questions. [Pg:150]

i) What does the bar graph present?
A) Population of cities in India
ii) Which is the least populated city?
A) Pune
iii) The population of Hyderabad is___( fill in the blank)
A) 2.0 crores
iv) Which city has the highest population?
A) Delhi
v) Name the cities with a population of two crores or above?
A] Delhi, Mumbai, and Hyderabad
vi) How many cities are present in the bar graph?
A) 5[five]
vii) The Population of Mumbai is ___ [ Fill in the blanks ]
A) 3 crores
viii) The population of Bangalore is 1 crore. Write true or false
A) false
5] Geta is a housewife. She saves a small amount every month. However, it is not uniform. The Bar Graph gives information about Gita’s savings for the first 5 Months of the Year. Study the Bar Chart and answer the following questions that follow. [Pg:151]

i) What does the bar graph present?
A) Geeta’s savings ( in 5 months)
ii) In which month did Geeta save the highest amount?
A) February
iii) During which two months did Geeta save very low amounts?
A) January and March
iv) How much did Geeta save in the month of May?
A) Rs. 2900
v) How much did she save in the month of April?
A) Rs. 3900
vi) How much more did she save in April than in March
A) Rs. 3000
vii) How much money did Geetha save in the month of March?
A) Rs. 900
viii) In the month of May, Geeta saved Rs 300. Write true or false.
A) False
6] Study the following bar graph and answer the questions that follow. [Pg:151]

i) What does the bar graph depict?
A)Transport preference among young people
ii) How many Modes of transport are mentioned in the bar graph?
A) Three
iii) Which is the most preferred mode of transport in the US?
A) Car
iv) What percentage of people preferred bicycles in France?
A) 45%
v) In Italy which is the least preferred mode of transport?
A) Motorcycle
vi) What percentage of people preferred motorcycles in the UK?
A) 10%
vii) Four modes of transport preferences are presented in the graph. Write true or false.
A) False
viii) What percentage of people preferred cars in France?
A) 40%
Extra] Study the bar graph below and answer ANY 4 questions given after it.

1] What does the bar-graph present ?
A] Sales of ice-cream of different flavors
2] Ice cream of which flavor do people like the most in shop A?
A] Ice-cream flavor of mango
3] How many ice creams of almond flavor are sold in shop B?
A] Sixty-five
4] Find the total number of ice creams of chocolate flavor sold in shops A and B.
A] 165
5] 30 Ice-creams of coconut flavor are sold in_____[ fill in the blank ]
A] Shop B
6] Ice cream which flavor do people like more in shop B ?
A] Chocolate
7] How many ice creams of mango flavor are sold in shop A ?
A] One hundred
8] How many ice cream flavors are shown in the graph ?
A] Five
Extra] Read the bar graph below and answer ANY FOUR questions given after it.

1] What does the bar graph present?
A] Favorite Students Of Students
2] How many students are shown in the bar graph?
A] five
3] Name the most popular subject.
A] Maths
4] Which subject is the favorite one with 50 students?
A] Math
5] Which subject is less popular: Science or English
A] science
6] The number of students who like social studies is ___.[fill in the blank]
A] thirty.
Tree Diagram
7] Literature plays an important role in our lives. There are several branches of literature. The tree diagram given provides, information on various branches of literature and the areas they cover. Take a close look at the tree diagram and answer the questions. [Pg:152]

i) What does the tree diagram describe?
A) Branches of literature
ii) How many main branches of literature are given in the diagram?
A) Four
iii) In which branch of literature can one find imaginative aspects?
A) In poetry
iv] Name any one class of drama?
A) Comedy or tragedy
v) Which branch of literature stands closest to life?
A) Short stories
vi) Mention the number of classes novels are divided into here?
A) Five
vii) Historical approach can be seen in novels. Write true or false.
A) True
viii) Regional approach can be seen in___(fill in the blank)
A) Novels
8] “Health is Wealth” is an important proverb. A disease bothers us, and they are many types of Diseases. However, all these are divided into two categories.
Study the following tree diagram and answer the questions that follow. [Pg:153]
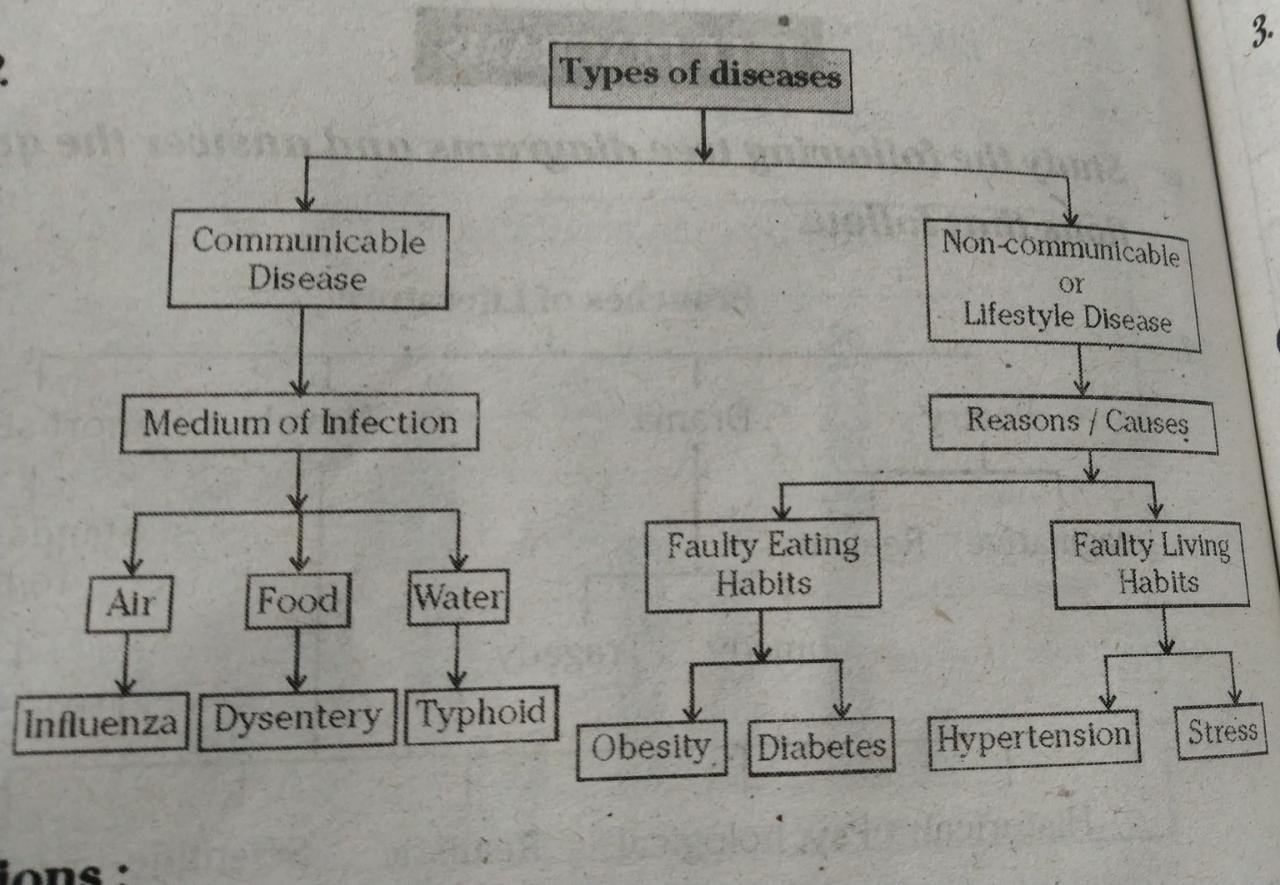
i) What does the tree diagram describe?
A) Types of disease
ii] How many main types of diseases are shown in the diagram?
A) Two
iii) Mention the reason for obesity?
A) Faulty eating habits
iv) Name the medium of infection for Typhoid?
A) Water
v) Stress is caused by___(fill in the blank)
A) Faulty living habits
vi) The medium of infection for influenza is____(fill in the blank)
A) Air
vii) Hypertension is caused by____(fill in the blank)
A) Faulty living habits
viii) Three broad types of diseases are mentioned in the diagram. Write true or false.
A) False
9] Study the following tree diagram and answer the questions that follow. [Pg:154]

i) What does the tree diagram describe?
A) Types of vitamins
ii) How many types of vitamins are mentioned in that diagram?
A) Four
iii) Mention any one source of vitamin A?
A) Milk or eggs
iv) Which vitamin does meat provide us?
A) Vitamin B
v) From which food do we get Vitamin C
A) Fruit and Vegetables
vi) Sunlight help us get___(fill in the blank)
A) vitamin D
vii) Eggs are rich in ___and____.[fill in the blank]
A) A and D
viii) Which vitamin do we get from milk?
A) Vitamin A
Extra] Study the tree diagram below and answer ANY 4 questions given after it.
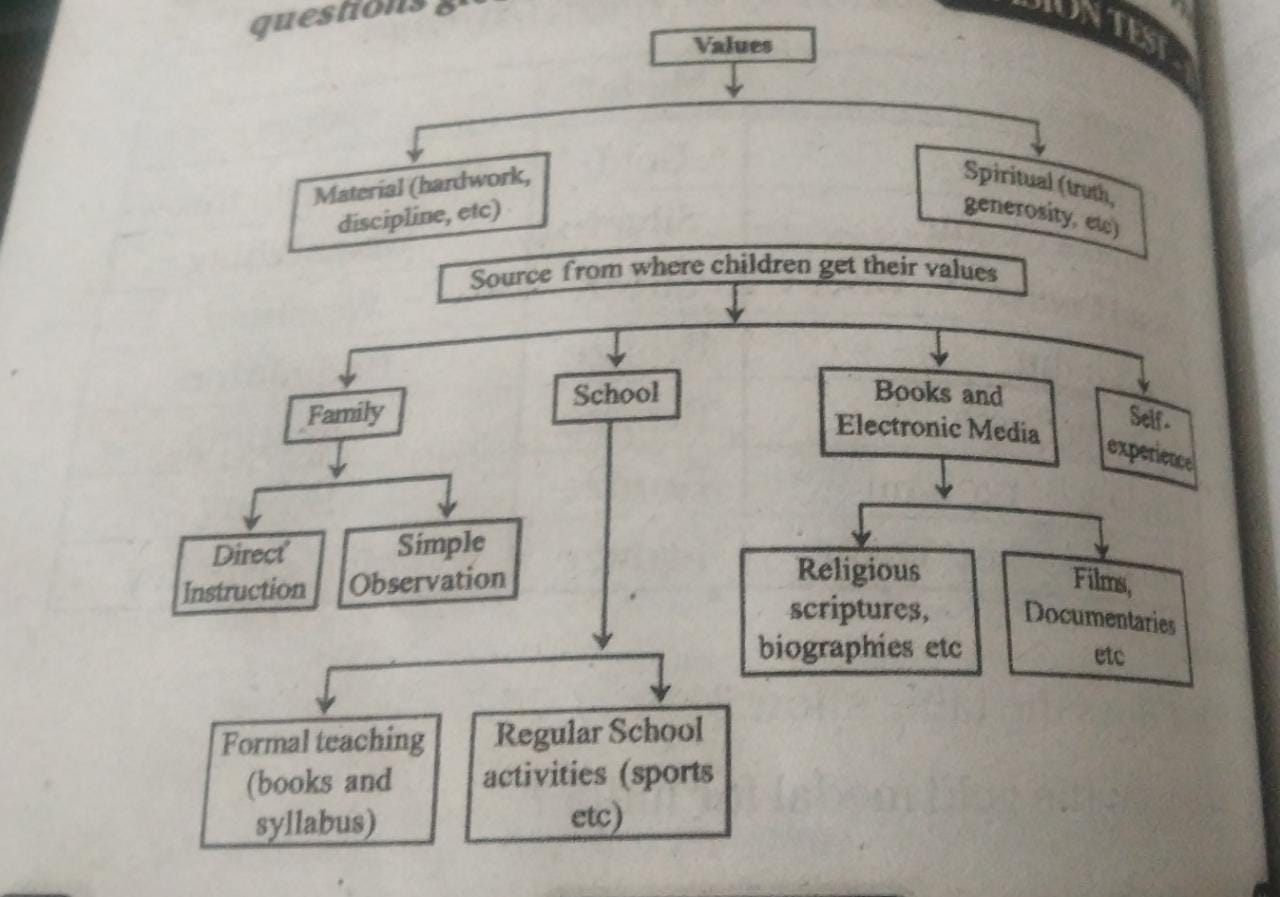
1] What does the tree diagram describe?
A] Values
2] What are the two kinds of values?
A] Material and Spiritual
3] Which value do hard work and discipline belong?
A] Material
4] Truth is a _______ value. [fill in the blank]
A] spiritual
5] From which source can one acquire that trait of simple observation?
A] Family
6] Generosity is material value. Write true or false.
A] False
7] children do get some values .write true or false.
A] True
8] Formal teaching consist of ______[ fill in the blank]
A] Books and Syllabus
Tables
10] Sports are an important part of our life. But each sport is played in a different way and in different places. The table provides information of the size of the court for different games. Study the following tables and answer the questions that follow. [Pg:154]

i) What does the table show?
A) Information of sports
ii) How many sports are represented on the stable?
A) Eight
iii) Of these sports, which has the highest number of players on the field?
A) Rugby (football)
iv) Which of these sports is played on a wooden surface?
A) basketball
v) How many of these sports have 11 players on the field at a time?
A) Three
vi) Which of these sports is played with a cylindrical projectile?
A) Ice hockey
vii) How many of these sports are played on ice?
A) Two
viii) Of these sports, which one has the Fewest players on the field at a time?
A) Curling
11] Thre are seven continents of different sizes in our world. Each continent also has a varying population and number of countries. The table provides comparative information on these three aspects.
Study the following tables and answer the questions that follow. [Pg:155]

i) What does the table show?
A) Continents, their area, number of countries, and their population
ii) How many continents are mentioned in the table?
A) Seven
iii) Which continent has the largest area?
A) Asia
iv) Which continent has the smallest number of countries?
A) South America (of course, Antarctica has no countries)
v) Which is the most populous continent?
A) Asia
vi) Africa has the highest number of countries. Write true or false
A) True
vii) How many countries does not America have?
A) 23
viii) Which continent has the smallest area?
A) Australia and Oceania.
12] Study the following tables and answer the questions that follow. [Pg:156]

i) What does the table show?
A) Indian Nobel Prize winners
ii) How many Indians have received the Nobel Prize to date?
A) Nine
iii) Who is the first Indian to receive the Nobel Prize?
A) Rabindranath Tagore
iv) Mother Teresa received the Nobel Prize for___(fill in the blank)
A) Peace
v) How many Indians have received the Nobel Prize for economics till now?
A) Two
vi) In which year did CV Raman receive the Nobel Prize?
A) 1930
vii) Who won the Nobel Prize in the year 2014?
A) Kailash Satyarthi
viii) In the field of medicine, who won the Nobel Prize for India?
A) Har Gobind Khorana.
Extra] Study the table below and answer ANY 4 questions given after it .

1] What does the table show?
A] India’s Medal Tally at Tokyo Olympics.
2] Who won the Gold Medal For India?
A] Neeraj Chopra.
3] Who won a bronze medal in boxing ?
A] Lovlina Borgohain
4] How many medals did India win at the Olympics?
A] Seven
5] Bajrang Punia won the bronze medal . Write true or false.
A] True
6] Mirabhai chanu won the silver in _____[fill in the blank ]
A] Weightlifting
7] India won 5 bronze medals at the Tokyo Olympics. write true or false.
A] false
8] Who won the bronze medal in badminton ?
A] PV Sindhu.
Flow Charts
13] The flow chart explains the procedure one needs to follow to open a bank account. Study the following flowchart and answer the questions that follow. [Pg:157]

i) What does the flowchart show?
A) The process of opening a bank account
ii) How many steps are given in the flowchart?
A) Five
iii) What should the customer do after completing the application for account opening?
A) Submit it along with identity certificate
iv) Who verifies certificates and information of the customer?
A) The bank (person)
v) Where does the customer need to sign?
A) On the deposit slip
vi) What will the bank issue at last?
A) Balance receipt passbook
vii) What steps come before issuing the deposit certificate to the customer?
A) Balance receipt passbook
viii) What does the bank open for the customer?
A) An account.
14] Online Examinations are becoming popular. The flow chart provides details of how to take an online examination. Study the following flowchart and answer the questions that follow. [Pg:158]

i) What does the flowchart describe?
A) The process of taking an online examination
ii) How many steps are given in the flowchart?
A) Ten
iii) After starting, what should be done?
A) Enter the username and password
iv) When can one start answering?
A) After getting the test questions?
v) When can one submit a test paper?
A) After completing answering questions
vi) Where can one select the question type and test range?
A) On the student home page
vii) When can one enter the student home page?
A) After entering username and password correctly
viii) If one enters the wrong username what should be done?
A) Should re-enter it.
15] Study the following flowchart and answer the questions that follow. [Pg:159]

i) What does the flowchart describe?
A) The process of getting a driving license.
ii) How many steps are given in the flowchart?
A) Eight (8) if fails (9)
iii) What test should one pass to go for a written test?
A) Eyesight test
iv) What happens when one doesn’t pass the eyesight test?
A) Loses the chance to get a driving license
vii] What should one do after clearing the eyesight test?
A) take theoretical lessons and a written test.
v) What happens when one fails the written test?
A) Retake the written test
vi) What happens when one clears the written test?
A) Practices driving
vii) What can an applicant do after practicing driving?
A) Take the road test
Extra] Study the flowchart below and answer ANY 4 Questions given after it.

1] What does the flow chart describe?
A] problem-solving
2] How many steps are given in a flow chart ?
A] Six
3] What should you do to get important information?
A] read the question
4] What is the third step?
A] Choosing the correct method
5] To solve the problems, what needs to be followed?
A] make sure that all steps are followed correctly
6] Calculation and operation are found in _______[fill in the blank}
A] in the third step-choose
7] What do you need to find out?
A] answer
8] What is to be checked at the end of solving the problem?
A] Answer
